In this post, I’ll show you how to use Google Chrome’s developer tools to inspect AJAX requests made by a web application.
How to open the tools
While in Google Chrome, right-click anywhere on the website, and click “Inspect Element”. From there, you will see different tabs that take you to different tools, which I will explain below.
The Network Tab
This tab shows all the resources that are loading on the page, like HTML files, css, javascript, images, etc.
The most useful feature I’ve used is the ability to see AJAX requests, their headers and their response. This is very useful when your application uses AJAX to bring data from a web server, and you can use this to understand what data is being brought back, in what format, or what parameters were sent in the request.
To filter the Network tab by AJAX requests, click on the XHR sub-tab.
Let’s see an example:
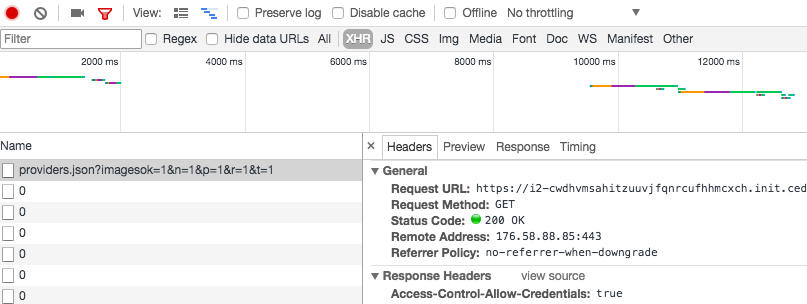
Here you can see that an HTTP GET request was made to this URL. You can see things like the Status code, the IP address of the server being contacted, etc.
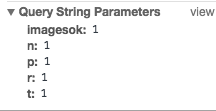
If you scroll all the way down, you’ll see the query string parameters that were sent in the GET request. This can help you understand why you received a certain response (assuming the web server uses these parameters to determine the response)
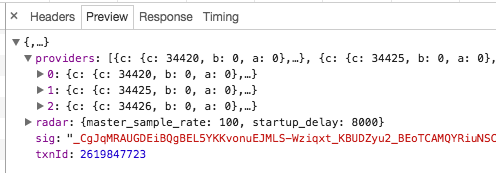
Finally, by clicking on the Preview subtab, you can see the JSON response, and you can expand the different nodes of the hierarchy

In many cases, all these information might be available through different log files in the backend server of the application you are working on, but this incredibly useful feature makes things easier as you can immediately see the request/response, and any other details that can help you understand and debug a problem.
